Platform
Monitor, update and analyze — without returning to the field.
Every sensor reports to one place. Configure it, watch its health, update its firmware and pull its data — SeedLink v3, FDSN WebService, and WireGuard so the fleet can sit on your private network.
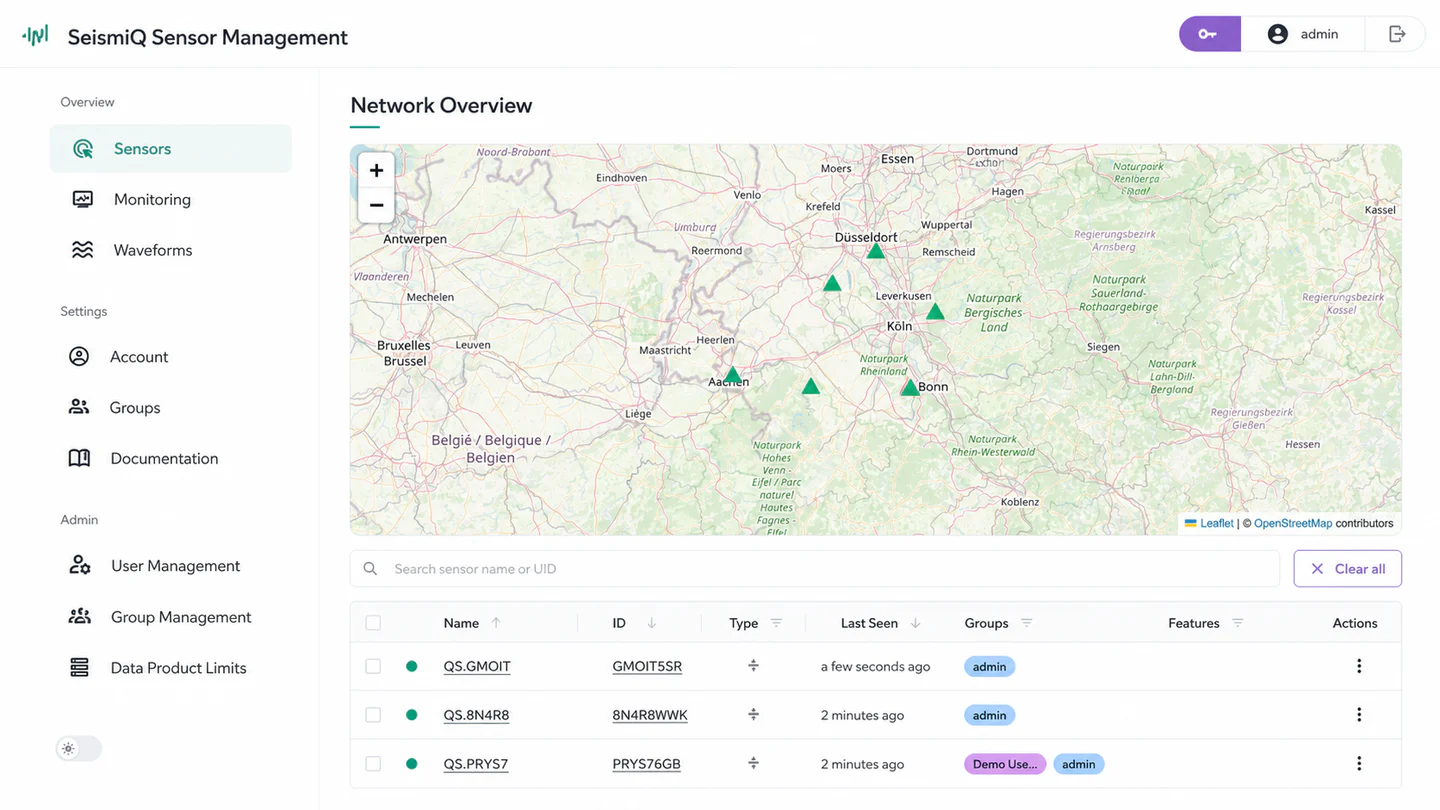
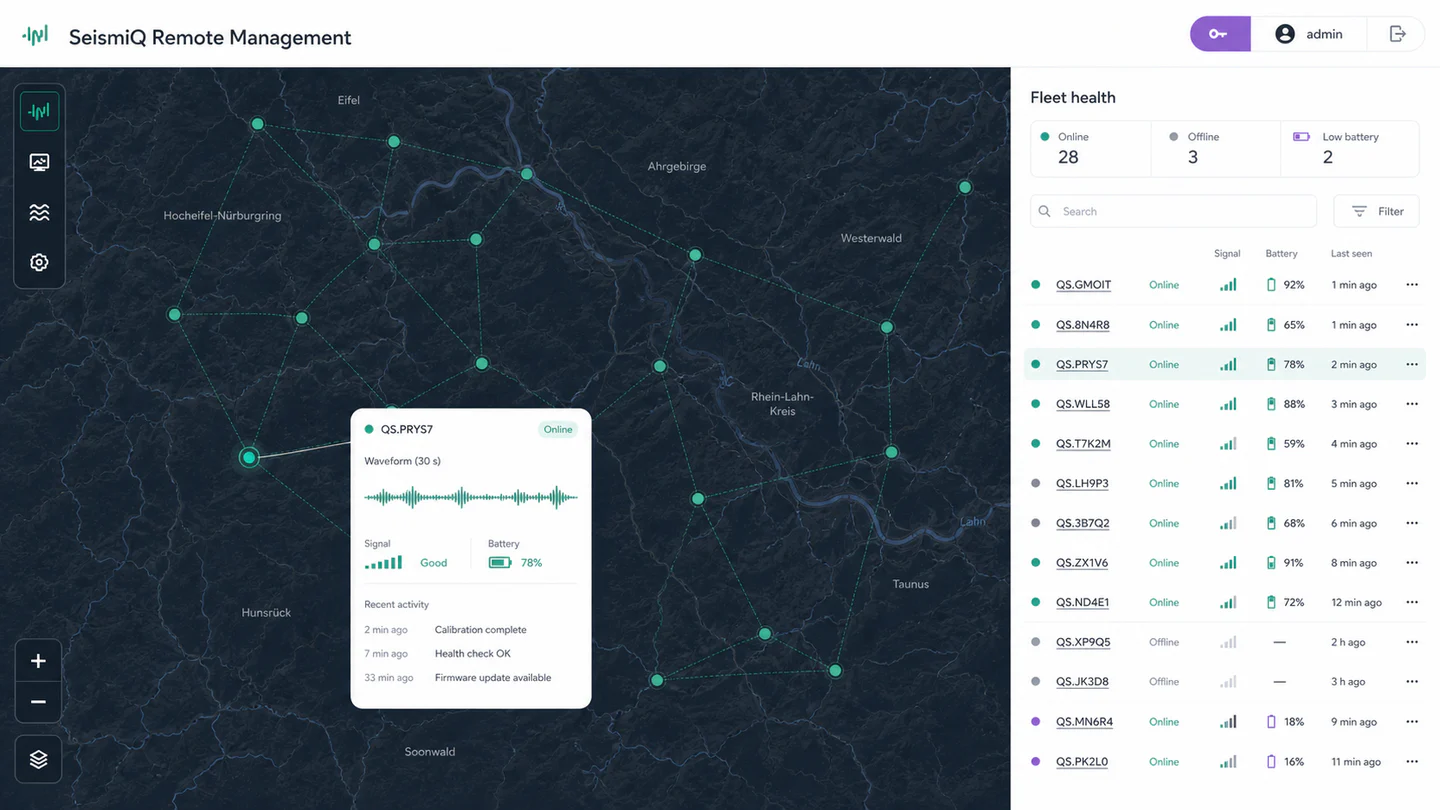
Remote management
Fleet visibility and control
Every sensor is configured, monitored and updated from one place. Waveform access runs through local and central SeedLink servers and FDSN WebService. WireGuard is integrated so the fleet can sit inside your private network.
Network visibility
Sensor status, recent activity and network organisation in one view.
Remote configuration
Acquisition parameters and sensor groups, on any node, including in bulk.
Continuous access
Waveforms and StationXML through central SeedLink v3 and FDSN WebService.
Fleet operations
Secure OTA updates
Firmware ships over the air on an A/B partition. The incoming image is verified before the sensor switches to it, and an automatic rollback fires if it fails to boot — so a fleet update cannot brick a station.
- A/B partitions with verified switchover
- Automatic rollback on boot failure
- No physical access after installation
- Customizable firmware for project-specific processing
Interoperability
Open by design
Every sensor is an FDSN-compatible station. If your tooling speaks SeedLink or FDSN today, it speaks to a SeismiQ network with no adapter layer. WireGuard is integrated when your security policy requires the fleet on a private network.
- SeedLink v3
- Real-time waveform streaming, on the sensor and centrally.
- FDSN WebService
- MiniSEED waveforms and station data.
- StationXML
- Metadata the sensors maintain themselves.
Edge analytics
Data products computed on the sensor
The processor in every node runs the real-time analysis stack, so what reaches you is already a result. Raw waveforms stream alongside it.
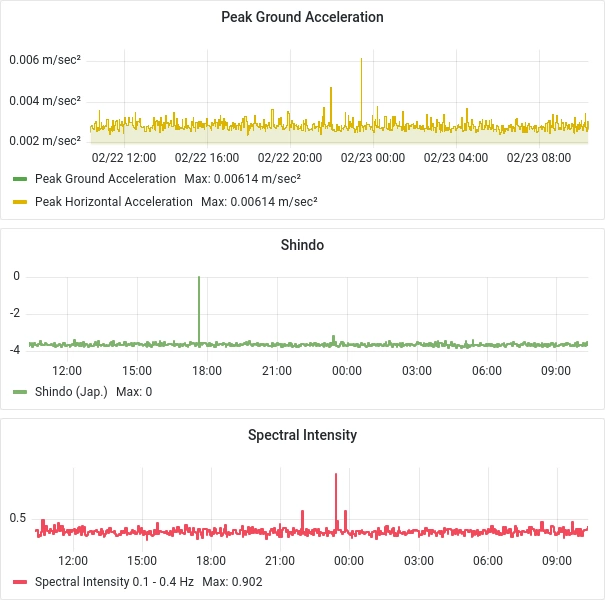
Ground motion
PGA, PGV, RMS and instrument intensities, calculated continuously.
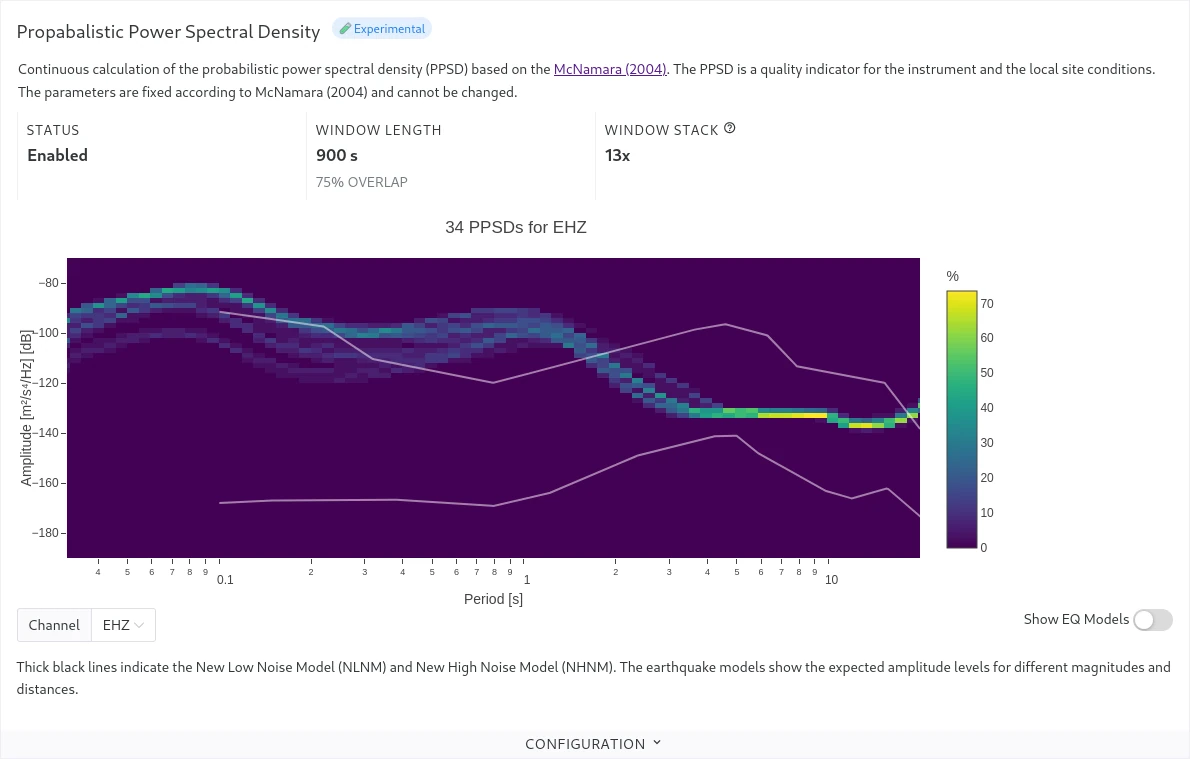
PPSD
Continuous probabilistic power spectral density for station quality and changing noise.
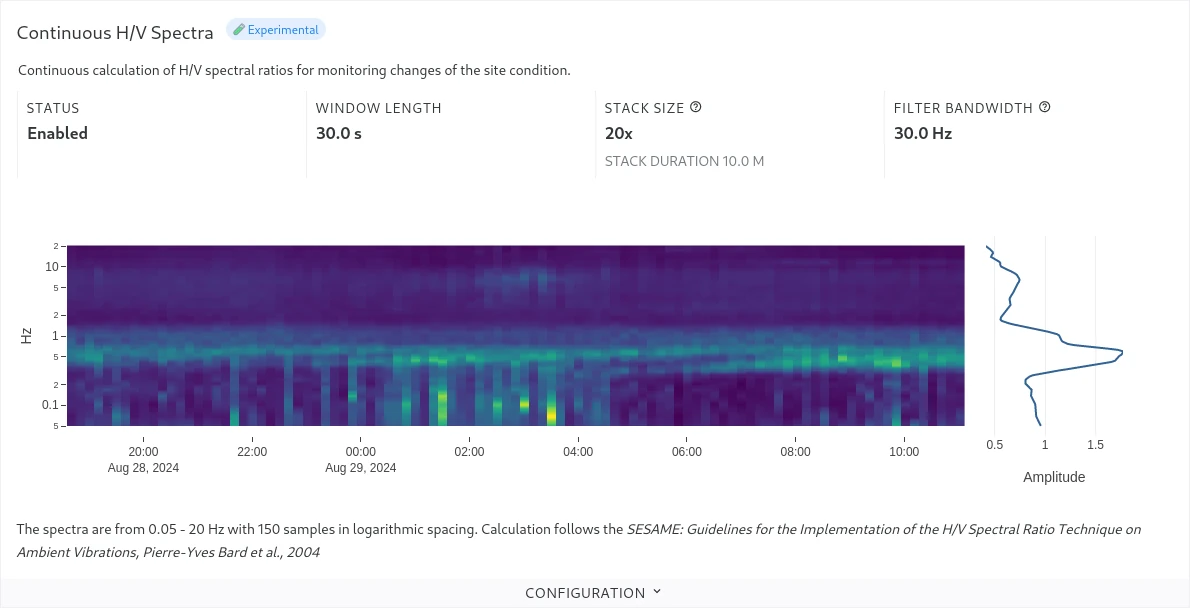
H/V spectra
Continuous horizontal-over-vertical spectral ratios, so a shift in site response is visible as it develops.
Ready to operate the network from one place?
We will walk you through a real fleet rather than a slide deck.